Introduction
The aim of this project is to develop and analyze a navigation solution for a moving receiver that assumes a two dimensional plane of constant altitude. With this setup, only 3 satellites are needed to determine a navigation solution. One of the CASES receivers was attached to a car. The car then drove in a loop around Itahca while the receiver logged observables and ephemerides. The data was provided and a 2D navigation solution was developed from code templates. The results were remarkably accurate considering the solution only used 3 satellites. The background and code structure are discussed in section 2, followed by an analysis of different satellite combinations and dilution of precision in section 3. The 2D navigation solution is compared to the 3D solution in section 4, altitude variation is considered in section 5, followed by the conclusion.
Code and Methodology
For the two dimensional problem it is convenient to work in the local coordinates frame. Therefore the range is given by
\(\rho^j = \sqrt{(X^j-x_{\text{local}})^2 + (Y^j-y_{\text{local}})^2+(Z^j - (R_e+h))^2} ~~~~~ (1)\)
where the satellite locations were calculated from the ephemerides, corrected for the earth’s rotation, and transformed into the local coordinate system. The location of the receiver in local coordinates is simply [0;0;Re+h]
where $R_e$ is the radius of the earth at the location of the observer and $h$ is the constant altitude. Like the 3D solution, the observer location begins with an initial guess and is iterated until convergence for $x = A^{-1}l$ using Eq. 2.
The provided navsolnlocal.m formats the ephemeris and observable data and uses pseudocalc.m to correct the pseudorange for the transmitter clock error before solving for the receiver location in solvePos.m. Thus, in the solvePos.m file where the iteration to the solution occurs, $l$ is simply
\(l = P^j - \rho_0^j ~~~~~ (3)\)
In order to efficiently manipulate inputs, I made a script called runCalcs.m that followed a similar procedure as navsolnlocal.m but allowed for greater tunability. Using a for-loop, the script saves the latitude-longitude solution from the 2D and/or 3D solution into an array that can be exported as a .csv file for a specified range of samples. Additionally, there is logic to neglect the solution when indexing through the array if one of the chosen SVIDs is not observable for a given sample. Lastly, the created runCalcs.m script also saves the GPS time, GDOP, and PDOP for the 2D navigation solution, in order to aid in analysis. The code for all the mentioned scripts as well as completed code templates can be found in the appendix.
Satellite Combinations and DOP
The 2D navigation solution was first determined for the satellite combination [4 10 17], as per the project guideline suggestion since this combination was available at for the vast duration of data collection.
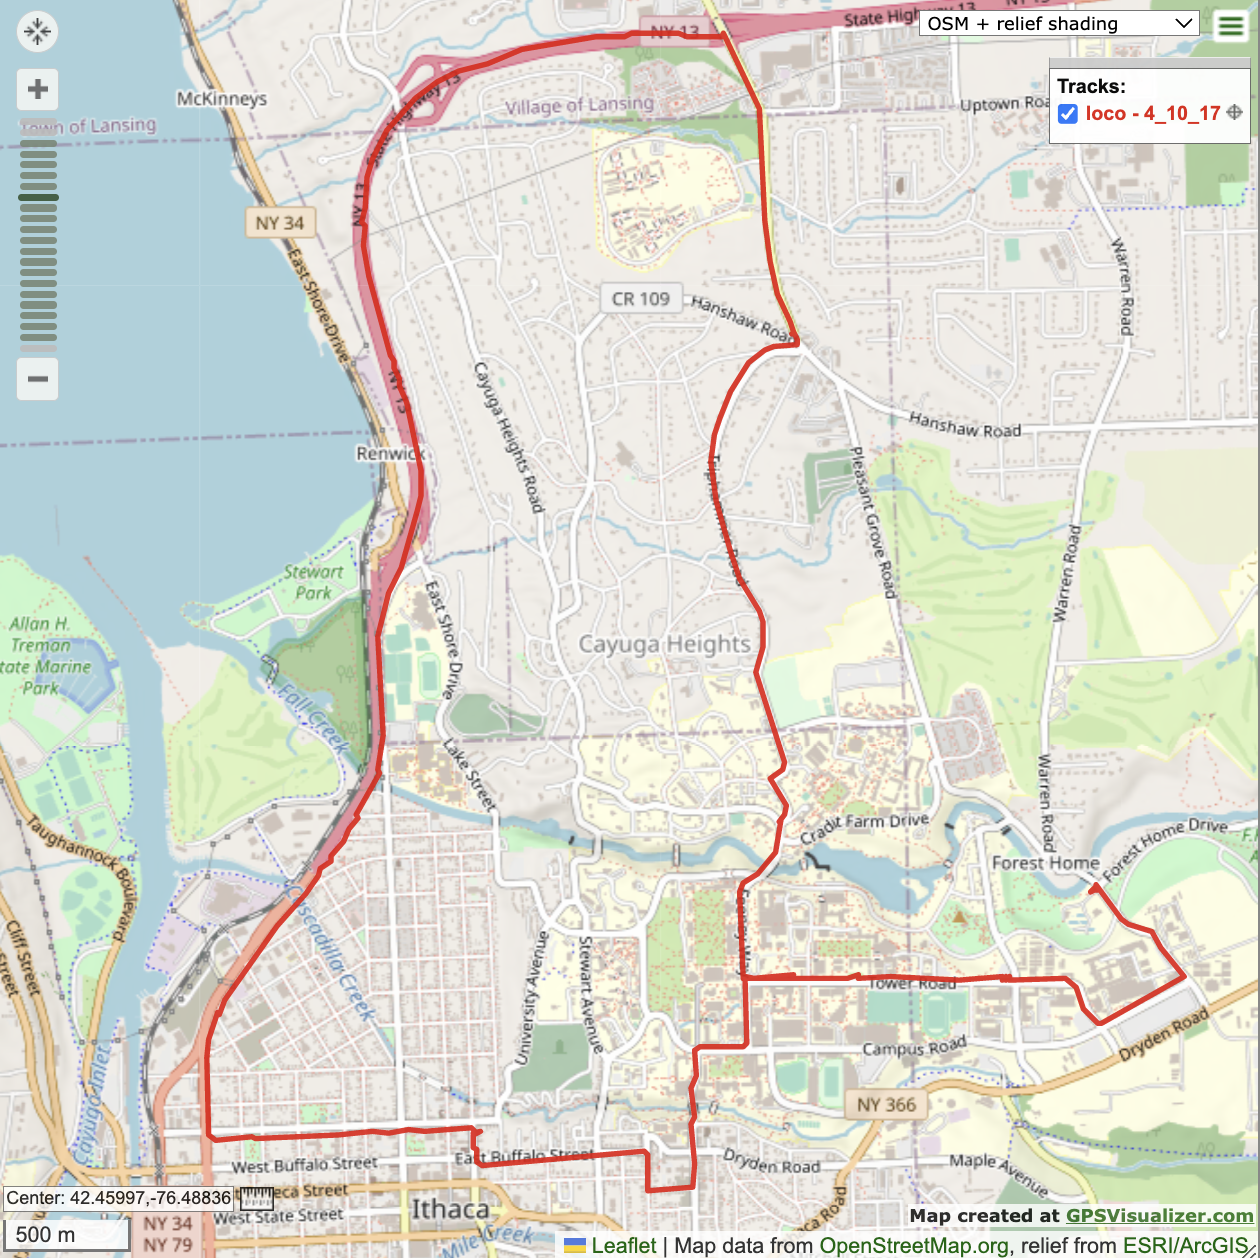 Figure 1. 2D navigation solution with satellite combo [4 10 17].
Using a for-loop the 2D navigation solution was calculated for every data point between sample 12 and sample 1725. Samples in which a satellite failed to report a pseudorange were neglected. The latitude and longitude were formatted and plugged into the provided GPS visualizer. The result is shown in Figure 1. Overall, the solution accurately portrays the location of the car on its route. It’s very easy to tell which road the car is on at a given instant, and the 2D solution appears to be working well. However, this solution is only representative of one of the possible combinations of satellites, specifically [4 10 17]. Different combinations of satellites were investigated in order to see how they affected the 2D solution. The elevation and azimuth of each observable satellite were found using satPos.m. The elevation and azimuth plot is shown in Figure 2 with corresponding numerical values in Table I.
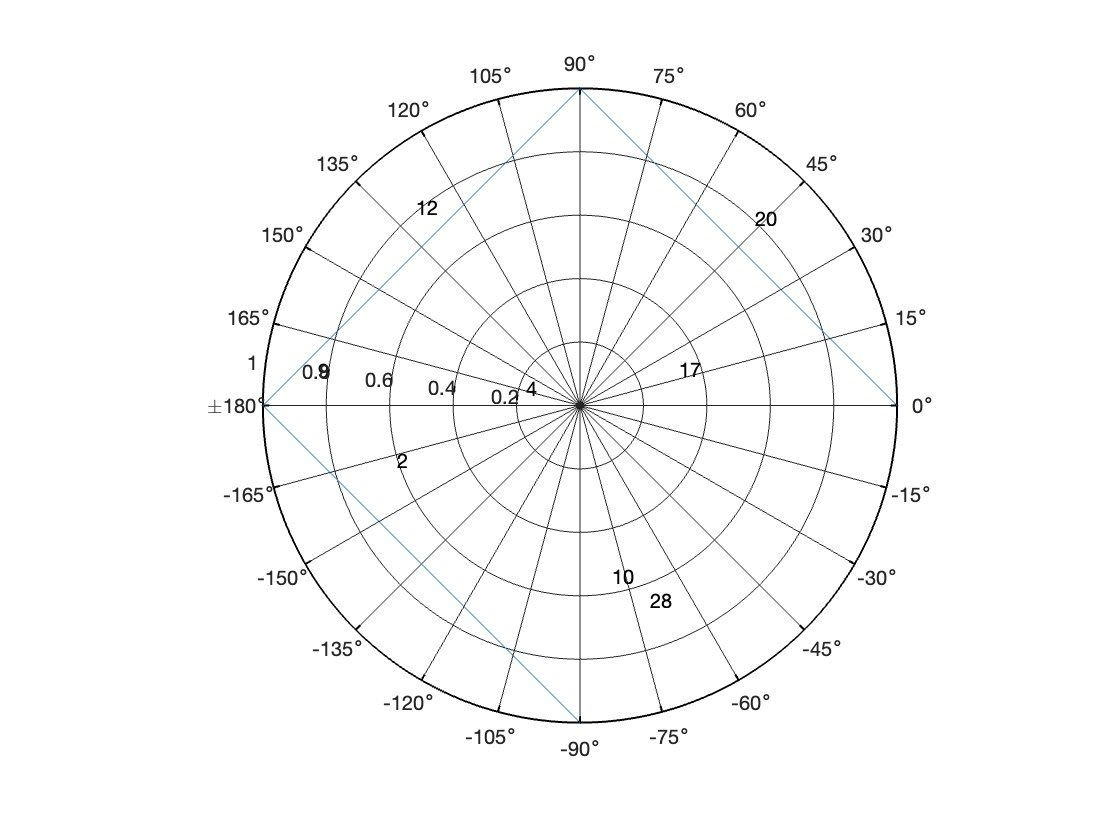 Figure 2. Elevation and azimuth plot of observable satellites
| SVID | el (deg) | az (deg) |
|---|---|---|
| 2 | 33.7 | 247.3 |
| 4 | 74.7 | 264.8 |
| 9 | 15.5 | 272.9 |
| 10 | 34.5 | 170.6 |
| 12 | 21.6 | 317.1 |
| 17 | 61.6 | 81.6 |
| 20 | 21.7 | 46.6 |
| 28 | 25.5 | 161.1 |
Table I. Elevation and azimuth for observable satellites
The chosen satellites of [4 10 17] are not in a line nor do they have too low an elevation, as they are all above 20 degrees. Moreover, they are relatively spaced out. To investigate the different satellite combinations, three combinations were chosen with the following characteristics:
1. Satellites in a small cluster
2. Satellites that form a line in the sky
3. Satellites that are in a large, space-out triangle shape
Satellites in a Line
The satellite combination that forms a line was chosen to be [2 9 10] for samples 190 - 804, as this was the range of samples in which all 3 were observable. The 2D navigation solution was produced with this combination and plotted using the GPS visualizer with the original combination of [4 10 17] (Figure 3).
 Figure 3. 2D navigation solution with satellite combo [2 9 10] (blue) for samples 190 - 804 and combo [4 10 17] (red).
As expected, the solution from [2 9 10] is far less accurate than that from [4 10 17]. Qualitatively, it can be seen that the blue line is far more jittery than the red. Additionally, the blue line does not follow the roads as closely as the red. As the car goes down Catherine Street, Buffalo Street, and Court Street the blue line is significantly off of the road pictured on the map. Moreover, by the NY34 sign the blue line is significantly off the route and is very jittery. The differences can be quantified by dilution of precision. The dilution of precision was calculated for both satellite combinations at GPS time 403681 seconds. See code in runCalcs.m attached in the Appendix. In the two dimensional case, the GDOP and PDOP are given by Eq. 4 and Eq. 5.
The calculated GDOP and PDOP values for the different satellite combinations are shown in Table 2. Consistent with our expectations, the GDOP and PDOP values of the second combination, those that form a line in the sky, is significantly higher than those of the original combination. The GDOP value for [2 9 10] is 3.17 times larger than it is for [4 10 17] and the PDOP value is 2.74 times larger. This confirms the hypothesis that satellites that form a line in the sky would decrease solution precision. This was seen qualitatively through the GPS visualizer and now quantitatively with dilution of precision.
Additional sources of error from the [2 9 10] combination is elevation of SVID 9, which from Table I is roughly 5 degrees. At a low elevation, the satellite signal must propagate further through the ionosphere and neutral atmosphere. Since this solution does not incorporate ionosphere and neutral atmosphere delays, the solution accuracy is particularly susceptible to satellites with low elevation.
| Combo | GDOP | PDOP |
|---|---|---|
| [04 10 17] | 2.5454 | 2.4370 |
| [02 09 10] | 10.6127 | 9.1117 |
Table II. GDOP and PDOP for different satellite combinations
Satellite Cluster
As seen in the azimuth/elevation plot of Figure 2, 10 and 28 are the closest satellite pair. SVID 17 was chosen as the 3rd satellite, as there was no small cluster of 3 satellites available to choose from. Thus the satellite combination for this part of the analysis was [10 17 28], noting that the 10 and 28 were the driving factors of typical effects produced by satellites close together. The 2D navigation solution was plotted using the GPS visualizer along with the original combination of [4 10 17] (Figure 4).
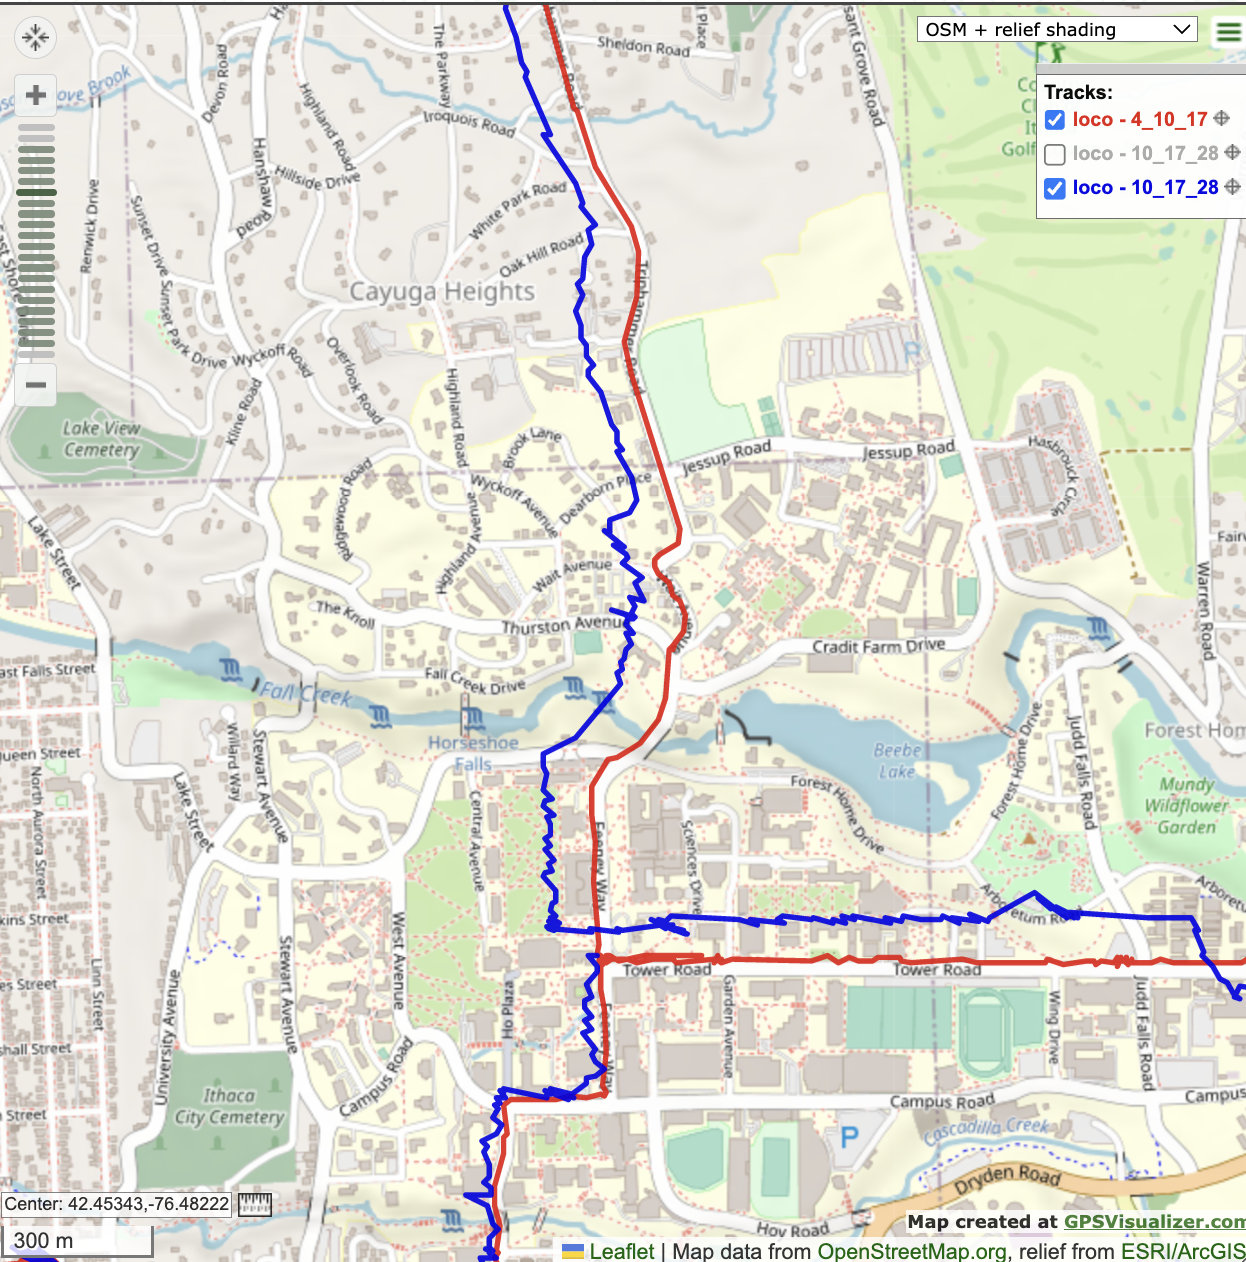 Figure 4. 2D navigation solution with satellite combo [10 17 28] (blue) and combo [4 10 17] (red).
It is clear that the solution produced by the cluster of satellites is worse than that of the original combination in terms of both accuracy and precision. From the blue line, the solution appears to be about one block off of the actual road, while the red line closely hugs the road throughout the duration of the route. Additionally, the blue line is very jittery, exemplified by the spikes and squiggles, while the red line is smooth. These observations were quantified by dilution of precision at a GPS time of 405000 seconds such that the car was on Tower Road. The results are shown in Table III.
| Combo | GDOP | PDOP |
|---|---|---|
| [04 10 17] | 2.7429 | 2.6107 |
| [10 17 28] | 7.9796 | 7.0205 |
Table III. GDOP and PDOP for different satellite combinations
Again, the DOP values correspond to the qualitative observations and the physical location of the satellites. Combination [10 17 28] had GDOP and PDOP values of roughly triple that of [4 10 17]. This is particularly interesting, as these satellite combinations only differ by one satellite. Both combinations have SVIDs 10 and 17, so the differences observed are due to using 28 instead of 4. The GDOP and PDOP increase significantly with 28 instead of 4 because SVID 28 is within 10 degrees of azimuth and elevation of SVID 10. Thus the region of overlap of the two satellites is greater, thereby decreasing precision. This led to inaccuracies and jitters in the navigation solution.
Spaced out satellites
The last combination of satellites was [2 17 28], as they are relatively spaced out and do not form a line in the sky. Since the spacing of this combination is similar spacing to the original [4 10 17], it is expected that the navigation solution will be closely aligned. Figure 5 shows the 2D navigation solution produced by the two combinations. It should be noted that the solution has been zoomed in to a particular instance of the car’s route, as the channels for the [2 17 28] combo were not always simultaneously observable. The result is nearly identical to the original combination, as the blue line almost perfectly overlays the red line. Both follow the gentle curves of the road very closely. Additionally, the blue line looks to be slightly smoother, indicating that the [2 17 28] combination produces a more precise result. The GDOP and PDOP values were calculated at GPS time 404352 seconds, where the observation location corresponds to the middle of the route section shown in Figure 5. The GDOP and PDOP for for [4 10 17] and [2 17 28] at GPS time 404352 are shown in Table IV.
The new combination has slightly lower GDOP, and especially PDOP, values. This explains why the blue line solution is slightly smoother than the red line. Other combinations with similar spacing were explored, such as [2 4 28], but overall [2 17 28] was found to be the best alternative to [4 10 17].
Since signals from [2 17 28] are not observable for the entire duration of the car’s route, the best navigation solution would be to switch between the best combination available at a given time. For example at a GPS time 404352 using [2 17 28], then when one of 2 or 28 becomes un-observable using [4 10 17], and perhaps using [2 4 28] on occasion. For the purposes of the lab, however, [4 10 17] will be used as the “best” combination as all SVIDs are observable during the whole route and the solution has relatively low DOP and all satellites maintain elevation above 20 degrees. Figure 1 demonstrates the accuracy of solution produced by [4 10 17] for the duration of the trip, as it stays along the roads and is relatively smooth the entire route.
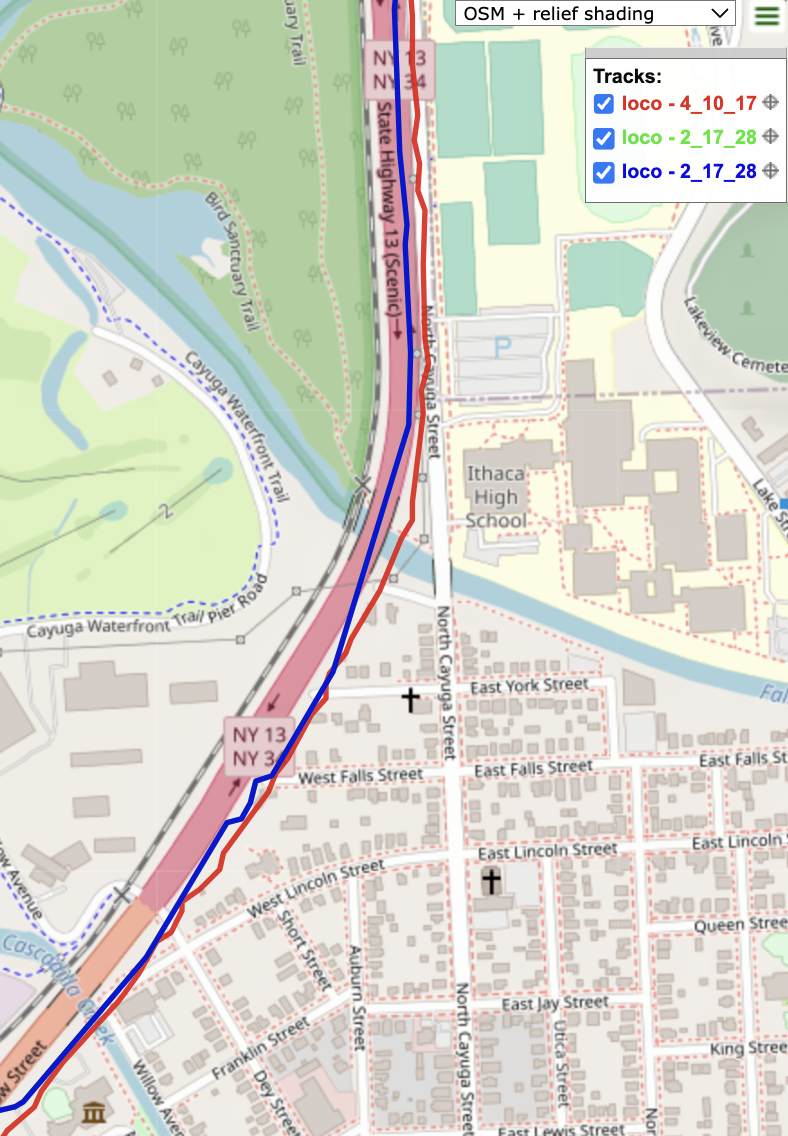 Figure 5. 2D navigation solution with satellite combo [2 17 28] (blue) and combo [4 10 17] (red).
| Combo | GDOP | PDOP |
|---|---|---|
| [04 10 17] | 2.6088 | 2.4977 |
| [10 17 28] | 2.0235 | 1.8494 |
Table IV. GDOP and PDOP for different satellite combinations
Comparison to 3D Solution
The 3D navigation solution was also produced for satellites [2 4 10 17] using the sovlepos.m function generated in class. The result is shown in blue in Figure 6. Note that the blue line that cuts across vertically rather than following Triphammer Road is a result of no 3D solution being developed during those time samples as SVID 2 was not observable. In certain regions of the route, the 3D navigation solution appears to be performing much better than the 2D solution. Fig.Figure 7 shows a portion of the graph in which the 2D solution has veered slightly off the road while the 3D solution is still within the bounds of the road.
 Figure 6. 3D navigation solution with satellite combo [2 4 10 17] (blue) and 2D navigation solution with combo [4 10 17] (red).
Upon consideration of the terrain of Ithaca, this makes sense. East Buffalo Street and West Court Street form a steep hill that the car descends in a relatively short period of time. During this time, the constant altitude assumption starts to break down. Thus, we see the 2D navigation solution appears to be below the actual roads that are Buffalo and Court street. On the other hand, the 3D navigation solution considers altitude variation, and thus is able to maintain accuracy during this time period.
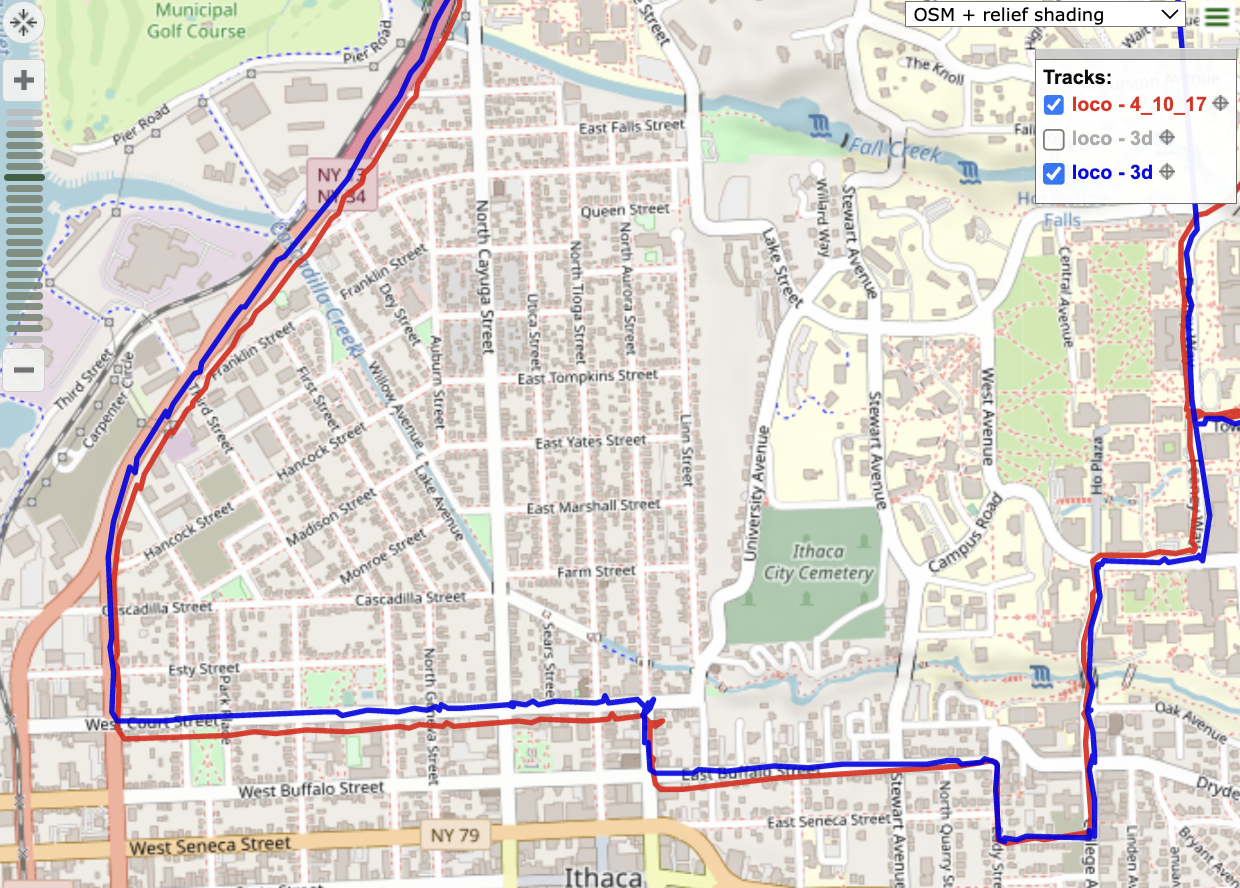 Figure 7. 3D navigation solution with satellite combo [2 4 10 17] (blue) and 2D navigation solution with combo [4 10 17] (red) for the steep hill region of the car’s route. As the car descends down the steep hill that is East Buffalo Street and Court Street, the 2D solution becomes less accurate, exemplified by the solution veering off the road. The 3D solution remains within the bounds of the road.
Additional points in which the 3D solution is more accurate than the 2D solution may occur when there isn’t necessarily an altitude change. For example, Fig.Figure 8 shows the 3D solution perfectly executing the hairpin turn onto Triphammer Road as it clearly within the bounds of the road, while the 2D solution has the correction shape associated with the turn but does not show that it is on the road itself. In this region, there is not a significant altitude variation. This is likely due to the fact that the 3D solution developed in class contains additional corrections that were not accounted for. The 3D solution uses findsatclock.m instead of findsat.m, contains the $a_{\delta_R}^j = \frac{\partial \rho^j}{\partial \delta_R}$ term for the receiver clock correction, and contains ionosphere and neutral atmosphere corrections. Thus, it makes sense that the 3D solution is found to be more accurate in certain regions that do not have an altitude variation. Overall, the results of the 3D solution and the 2D solution are essentially the same. This comparison highlights the remarkable accuracy produced by the 2D navigation solution. With one less satellite, producing what would generally be considered an under-determined problem, the 2D navigation solution comes to the same conclusion as that of the 3D navigation solution.
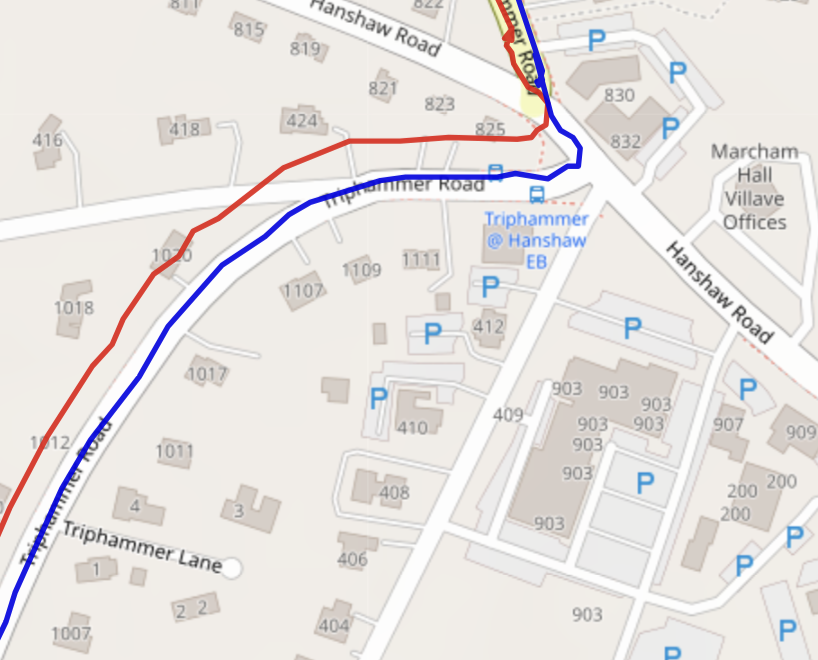 Figure 8. 3D navigation solution (blue) compared with 2D navigation solution (red) on a hairpin turn.
Effects of Altitude Variation
Throughout the analysis of Sections 3 and 4, the altitude was set to a constant altitude of $h = 120$ meters. In this section, the altitude was varied from 50 meters up to 250 meters to investigate how this would impact the 2D navigation solution. Fig.Figure 9 shows the 2D navigation solution for $h = 50$ meters (blue) and the original $h = 120$ meters (red). In the region shown, we see that the 50 meter altitude solution is more accurate than the 120 meter solution. The blue line stays within the bounds of the roads while the red line is offset. This is because the car is descending in this region of the route, and thus a lower altitude would produce more accurate results.
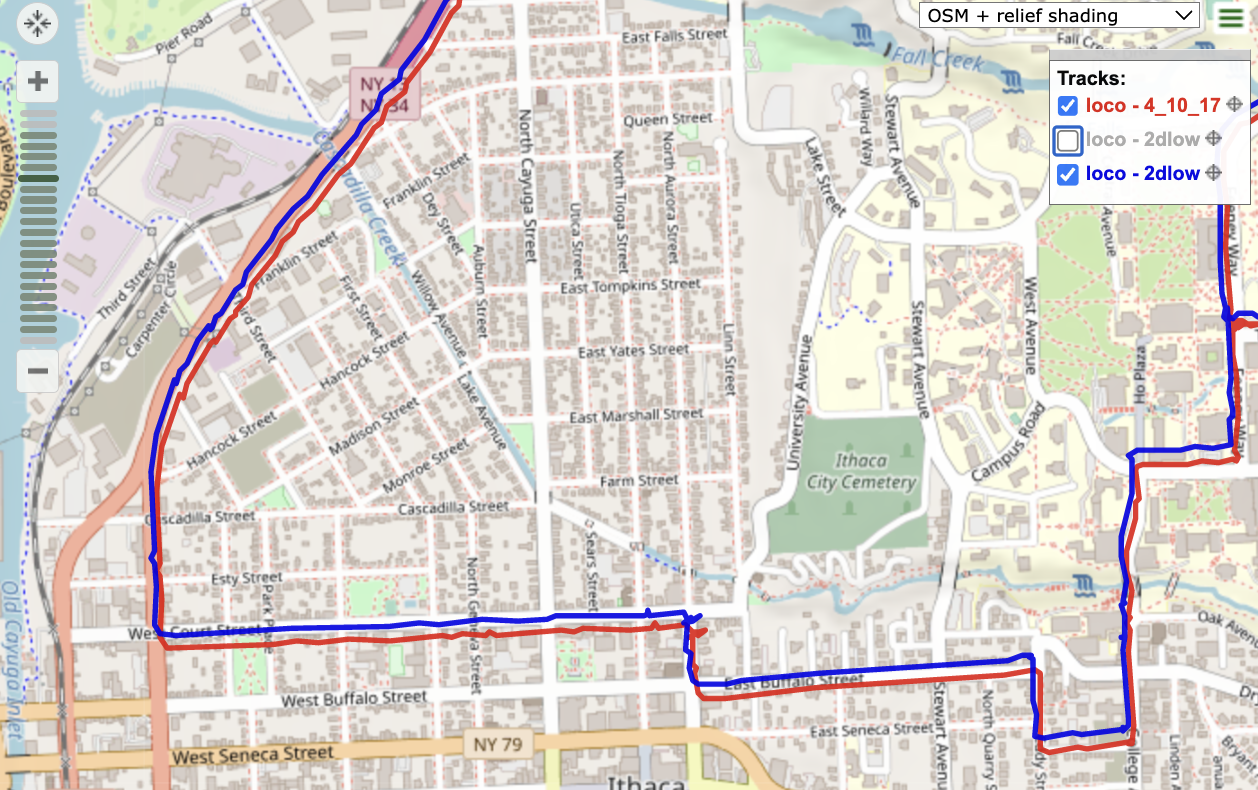 Figure 9. Comparison of 2D navigation solution using an altitude of 120 meters (red) and an altitude of 50 meters (blue). This is a snapshot of the route when the car is at relatively low altitudes.
In Fig.Figure 10 the $h=120$ solution is now more accurate than the $h=50$ solution, as we now see the blue line offset from the road while the red line closely follows the edges of the road.
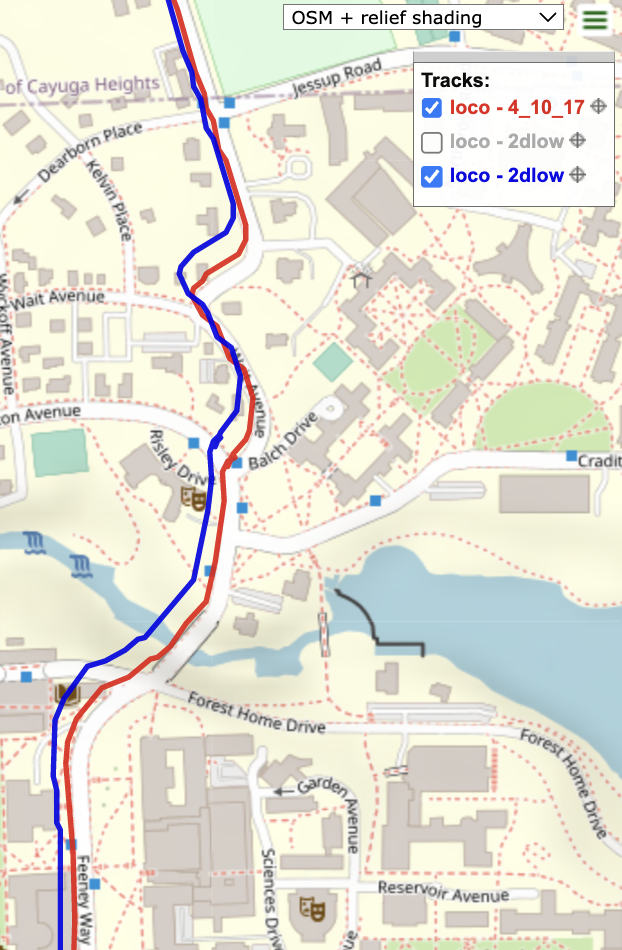 Figure 10. Comparison of 2D navigation solution using an altitude of 120 meters (red) and an altitude of 50 meters (blue). This is a snapshot of the route when the car is at relatively high altitudes.
The opposite effect is observed when an altitude of $h=250$ meters is used. In Fig.Figure 11 the $h=250$ solution (blue) is \textit{even more} offset from the road than $h=120$ solution (red). The blue line is more than half a block off of the accurate solution, indicating that, especially during this region, a high altitude produces a much worse solution.
Overall, it can be concluded that the 2D navigation solution is most accurate in regions that correspond to the constant altitude given. This is expected. In a hypothetical region where altitude is truly constant, the 2D navigation solution would not be making any approximations and therefore be just as mathematically rigorous as the 3D (not accounting for additional corrections or solving an over-determined problem). The overall solution worked best for an altitude of $h=120$ meters, as this is the average altitude of Ithaca. However, a lower altitude was found to be more effective in regions by Cayuga lake (which inherently have a lower altitude) and less effective near Cayuga Heights (which has a higher altitude). The contrary was found to be true when using an altitude above 120 meters. The 3D navigation solution does take the altitude variation into account, and therefore maintains accuracy for the duration of the trip.
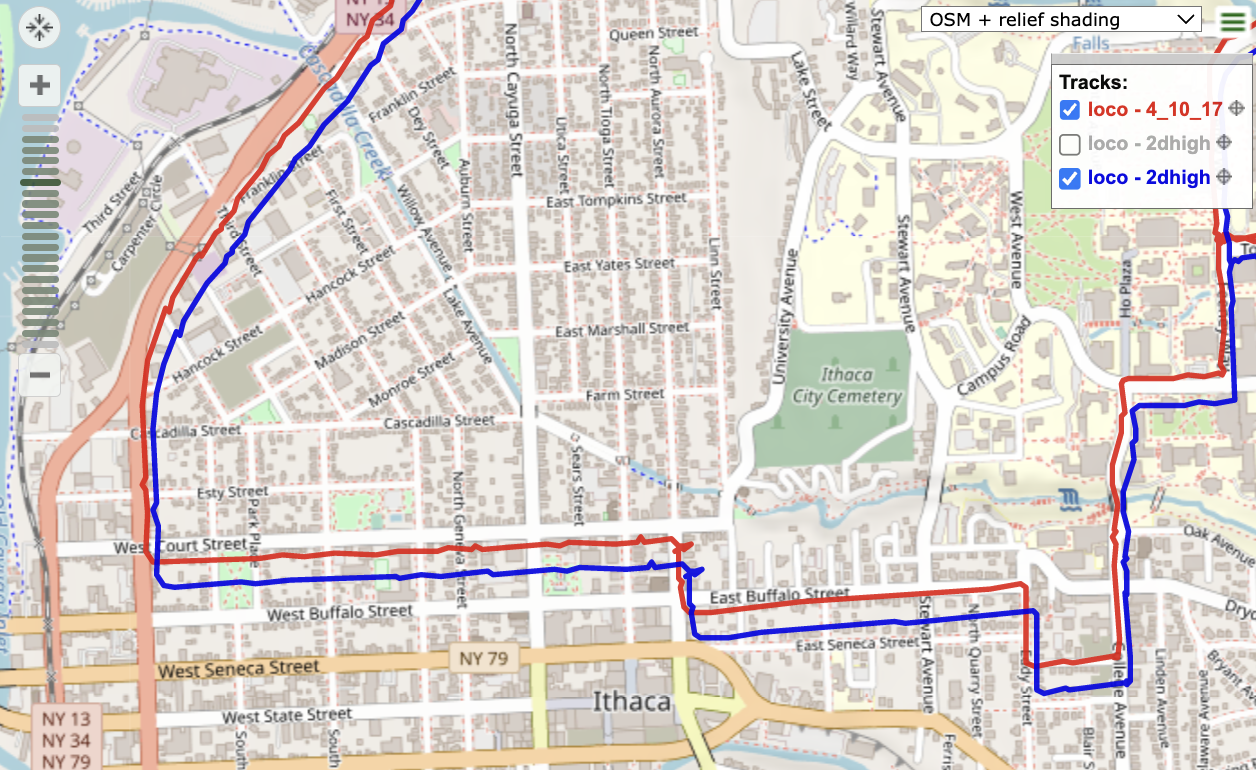 Figure 11. Comparison of 2D navigation solution using an altitude of 120 meters (red) and an altitude of 250 meters (blue) when the car is driving at relatively low altitudes.
Conclusion
The two-dimensional solution was determined for a receiver mounted to a car driving around Ithaca. Though the altitude of the receiver during the car’s journey, it was found that approximated the altitude to be a constant values of 120 meters enabled an accurate navigation solution in two-dimensions. Moreover, the two dimensional navigation solution required only 3 satellites, as the number of satellites to determine a solution is equal to $n+1$ where $n$ is the spatial dimension. The two dimensional solution was able to accurately track the motion of the car, as shown in Figure 1.
Different satellite combinations were investigated and it was found that, similarly to a 3D navigation solution, satellites that form lines in the sky or are in small clusters worsened the accuracy. This was characterized both by a visually worse navigation solution and by higher GDOP and PDOP values. Widely-spaced satellites, on the other hand, produced more accurate solutions and lower GDOP and PDOP values. Lastly, satellites with low elevation hindered results as they were more susceptible to ionosphere and neutral atmosphere effects, which were not corrected. The best combination was found to be[4 10 17] as these satellites were widely spaced, all above elevation of 20 degrees, and were observable throughout the most of the duration of data collection.
Additionally, the 2D navigation solution was investigated at a default altitude of 120 meters, but also at altitudes of 50 meters and 250 meters. For the 50 meter altitude, the navigation solution improved when the car was driving at low altitudes and worsened when the car was driving at high altitudes, and vice versa for the 250 meter altitude. This makes sense, as the two-dimensional solution works best when the receiver is at the altitude that corresponds exactly to the set “constant” altitude.
Lastly, the 2D navigation solution was compared with the 3D solution. The results were nearly identical with only minor discrepancies. These discrepancies resulted from the fact that the 3D solution accounts for altitude variation, which made it more accurate in regions where the true altitude deviated from the constant altitude provided by the 2D solver. Moreover, small discrepancies in solution arose because the 3D solver implemented advanced receiver clock corrections, ionosphere model corrections, and neutral atmosphere model corrections. Overall, this project demonstrated how an astonishingly accurate solution can be made with loss of data by making approximations.